Business Planning | Financial Analysis | Part 02
Following on the series of business planning related blog posts including:
What a good business plan looks like?
Developing a Business Planning Process
Professional Service Leverage Models
Leverage in a consultancy business
Vision, Mission and Objectives
Building a Service Proposition Framework
Market and Competitor Analysis
… this post looks at another key business plan element: Financial Analysis (Part 02).
If you are – as per my counsel – deliberately keeping alive the option of a value realisation point as part of your ultimate ambition, then it is a good idea also to start a self-assessment of this aspect from the off. As I described in Guide 02, there are some threshold levels to cross before you are potentially saleable but, beyond this point in your firm’s growth, you can start to estimate its value (as per the EBITDA x multiple logic). It is best to look at scenarios here – both as concerns your ability to actually grow profit and the kind of multiple you can achieve. The figure below illustrates the kind of schematic I would produce to explore this set of scenarios:
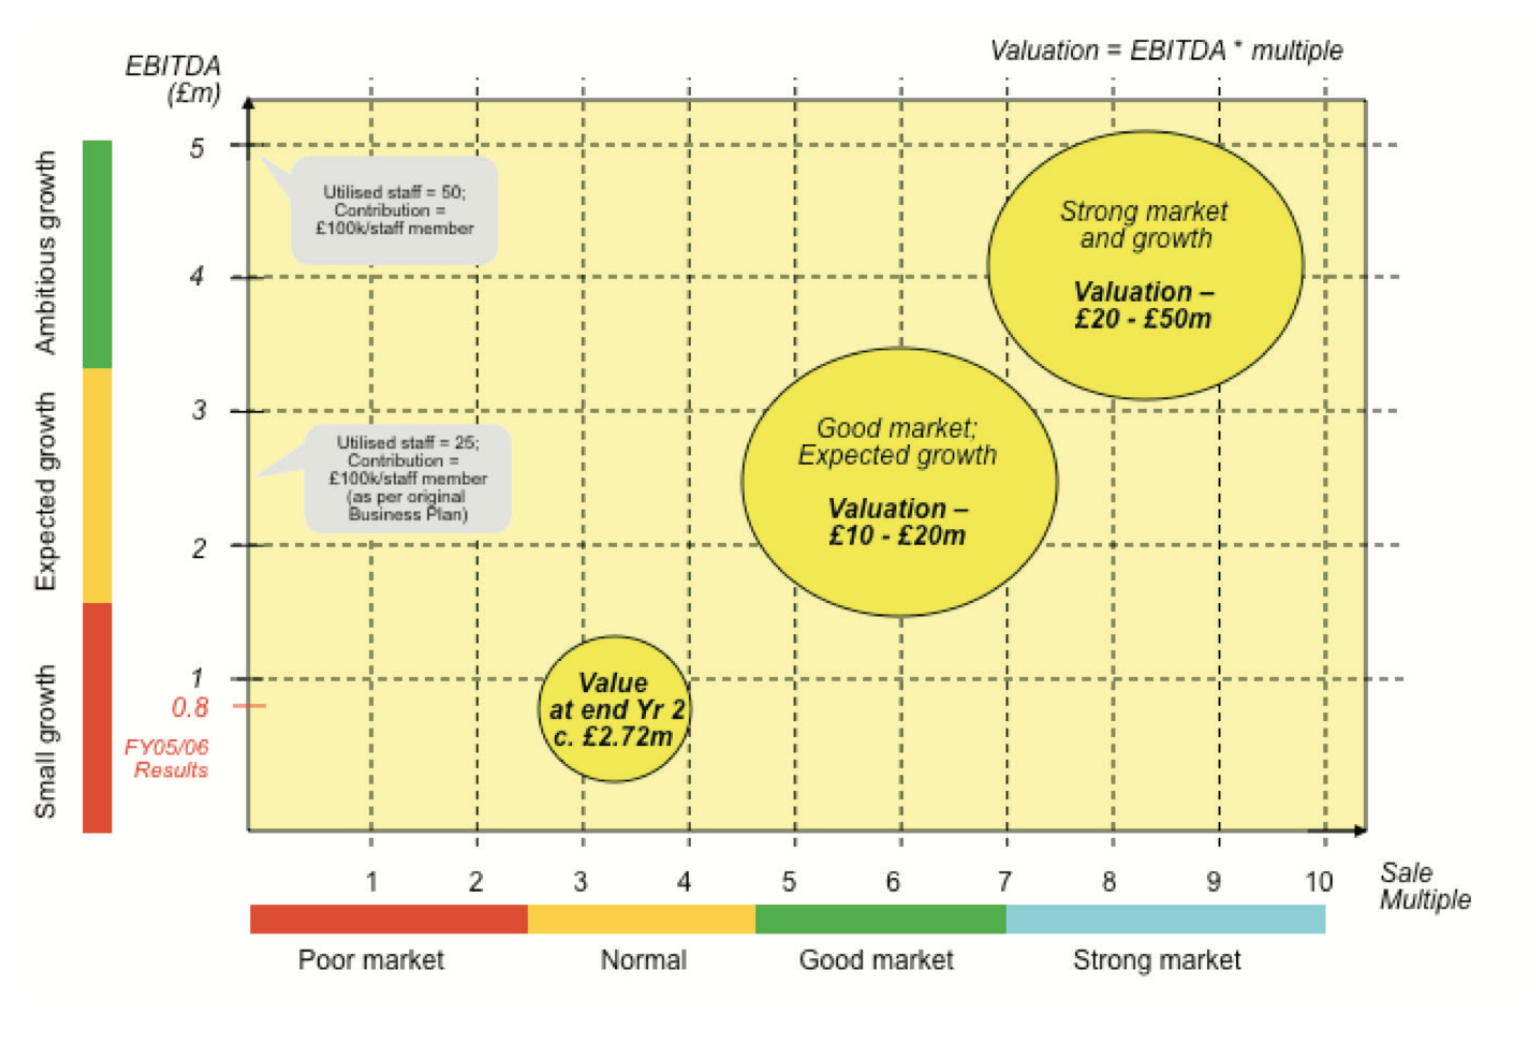
Figure – Valuation scenarios; this example produced in Moorhouse’s year two – looking ahead to end of year five
The work involved in the financial analysis (see Part 1 also) of your business plan clearly represents quite an effort but a carefully considered financial baseline is essential – else you will have no reference point for commercial success cf. failure; that is, of course, unless you become insolvent (a definitive fail). Such an outturn is of heightened probability in the absence of a financial plan.
Finally, having come so far in this part of your plan … make sure you apply some scenario, or sensitivity, analysis to some of your key assumptions. This involves producing conjectured pessimistic, expected and optimistic variants against some of your key items – your sales forecast is an obvious target for this. Examine the implications of each scenario – especially with regards to cash flow and funding. Such analysis will better prepare you for the road ahead; for example, do you need to examine contingency funding routes now perchance sales do not materialise as fast as you anticipate?
Funding – J Curves and Peak Cash Needs
A professional services firm can be started up with very little capital outlay. It is one of the real advantages of this type of business. That said – like every new venture – expect to see the cash go down (as you set the firm up and hunt for your first clients) before it goes up. That cash flow projection mapped to a timeline is known colloquially as a ‘J curve’ or the ‘hockey stick’.
Smart entrepreneurs always seek to get a detailed feel for this before they commit to their investment. As a key part of your financial analysis at start-up you need to estimate how long it will take for revenues to start building and, consequentially, how long to get to an operating cash flow break-even point. Make sure you ‘pressure test’ this with some pessimistic scenarios. An example ‘J curve’ is shown below.
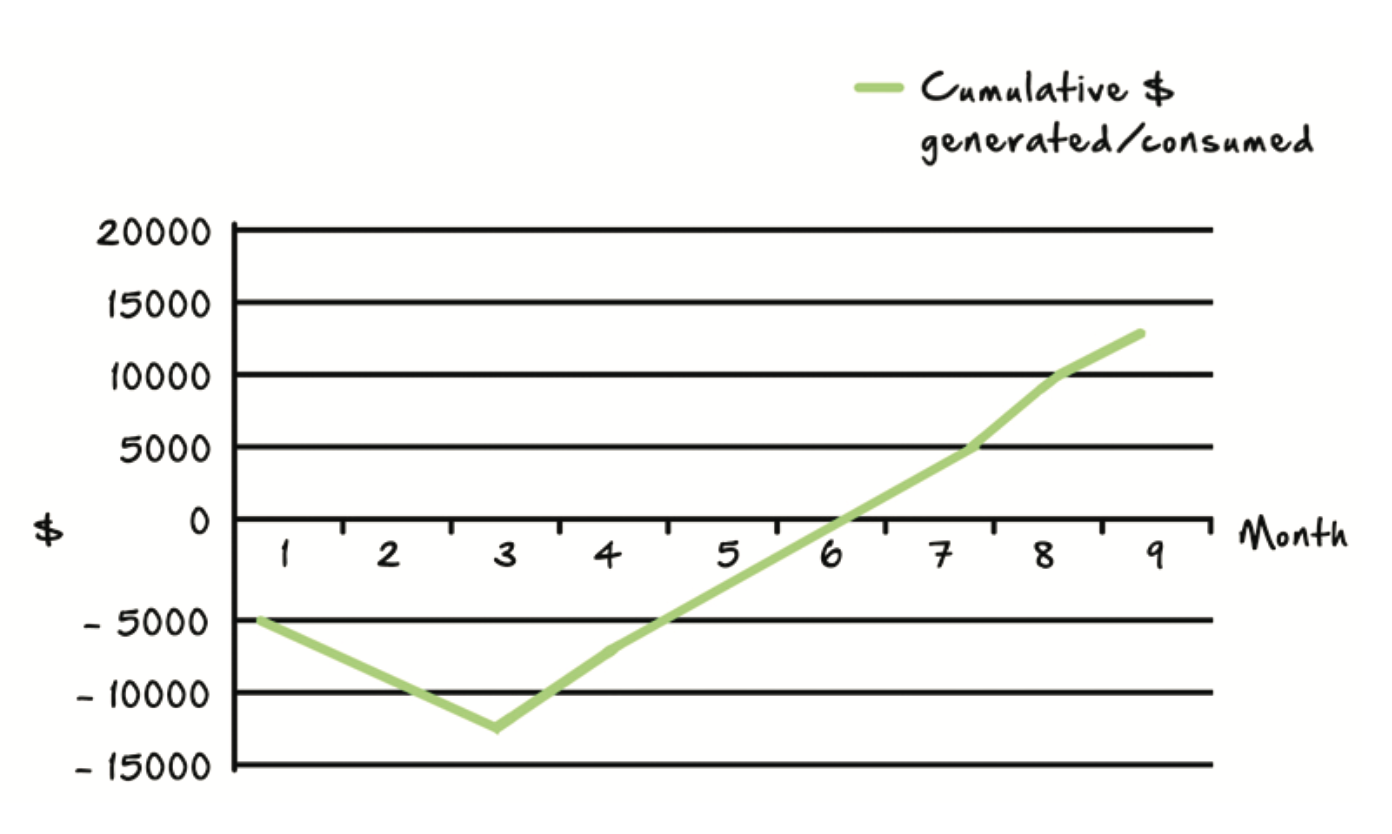
Figure – Example J curve – expected cash flow profile
In this example, noting this is a cumulative projection, you can see that the (monthly profit–loss) break-even point comes in month three when the curve turns (when cash in exceeds cash out for the first time). Importantly, this also indicates your peak cash need; that is the amount of cash reserve you will need (equity or bank loan/facility) to ride out this period of your company’s early development. In this example, it is around $12,000.
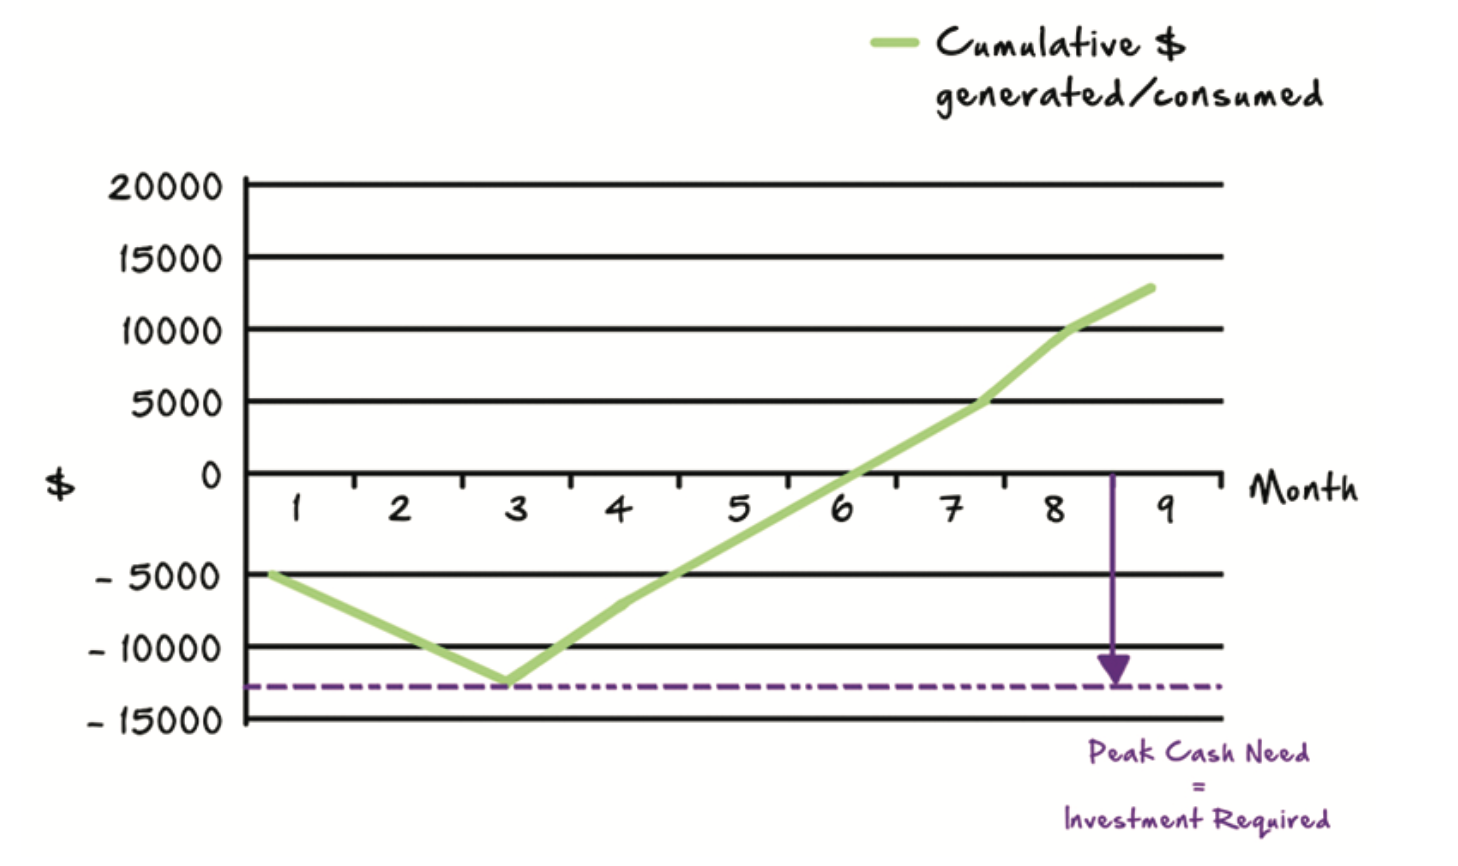
Figure – Example J curve – showing peak cash flow need
It is surprising how many budding entrepreneurs are either unaware of this simple concept (or who are aware but just choose to dodge the analysis). In start-up planning, having an informed view of your peak cash need is critical as you will see that with even relatively modest changes to the expected size and timing of projected revenues, the curve can deepen significantly.
————
If you are interested in re-charging your business ambition/strategy/plans, Dom runs an annual (three-day) Five-Year Entrepreneur Retreat – see here for previous delegate testimonials and details on future presentations. If you would like to make a reservation (capped to 14 attendees per Retreat) please drop a line via the contact page.

DOWNLOAD GUIDE 03 (BUSINESS PLANNING) HERE >>>