Business Planning | Financial Analysis | Part 01
Following on the series of business planning related blog posts including:
What a good business plan looks like?
Developing a Business Planning Process
Professional Service Leverage Models
Leverage in a consultancy business
Vision, Mission and Objectives
Building a Service Proposition Framework
Market and Competitor Analysis
… this post looks at another key business plan element: Financial Analysis (Part 01).

Photo Credit: edwardlich Flickr via Compfight cc
This section of your plan brings together multiple strands and is where it all becomes grounded in the reality of money. Over the horizon of your plan, broken down by sub-period (e.g. monthly for first year, then annually thereafter), it should include projections of:
- Sales (and ‘Cost of Sales’)
- Capital Spending
- Operating Costs
- Profit and Loss (P&L) Account (including net profit per owner estimates)
- Balance Sheet
- Cash Flow and Funding Requirements (see next blog also)
- Valuation
Taking each in turn:
Sales (and ‘Cost of Sales’)
As your firm grows, so the sophistication, and accuracy, of your sales forecasting should grow. Even in the first iterations, however, it should be predicated on some set of probability-weighted assumptions concerning the number of client engagements you can win (top-down analysis) or the size of firm, and utilisation levels, you can match work to (bottom-up analysis). This coupled with a proposed rate card, and year-on-year growth targets, gets you to the headline revenue estimates. Remember that your sales will, invariably, be also affected by a seasonality, so make sure you factor this in. You should also, in this section, calculate the ‘Cost of Sales’; that is the salary (plus ‘on cost’) of the billed staff in each period to arrive at your ‘Gross Profit’ and ‘Gross Profit %’ figures.
Capital Spending
Most professional service businesses have minimal capital outlay; certainly so in the formation years. There will, inevitably, be some such as: office infrastructure, IT equipment, capitalised start-up costs etc. You should list such items here along with the asset depreciation schedule (e.g. straight-line over x years).
Operating Costs
This section requires some attention to detail. You should work through all the potential areas of operating cost (for example, as per table below) and estimate costs per period. Forecasting is a skill in itself so take care here; some aspects will have a fixed relationship with another cost item (for example, laptop costs will correlate with the number of staff you employ), other costs may just change (invariably upwards) at a certain rate and others may have a seasonal pattern. Note all the assumptions you make in building this projection.
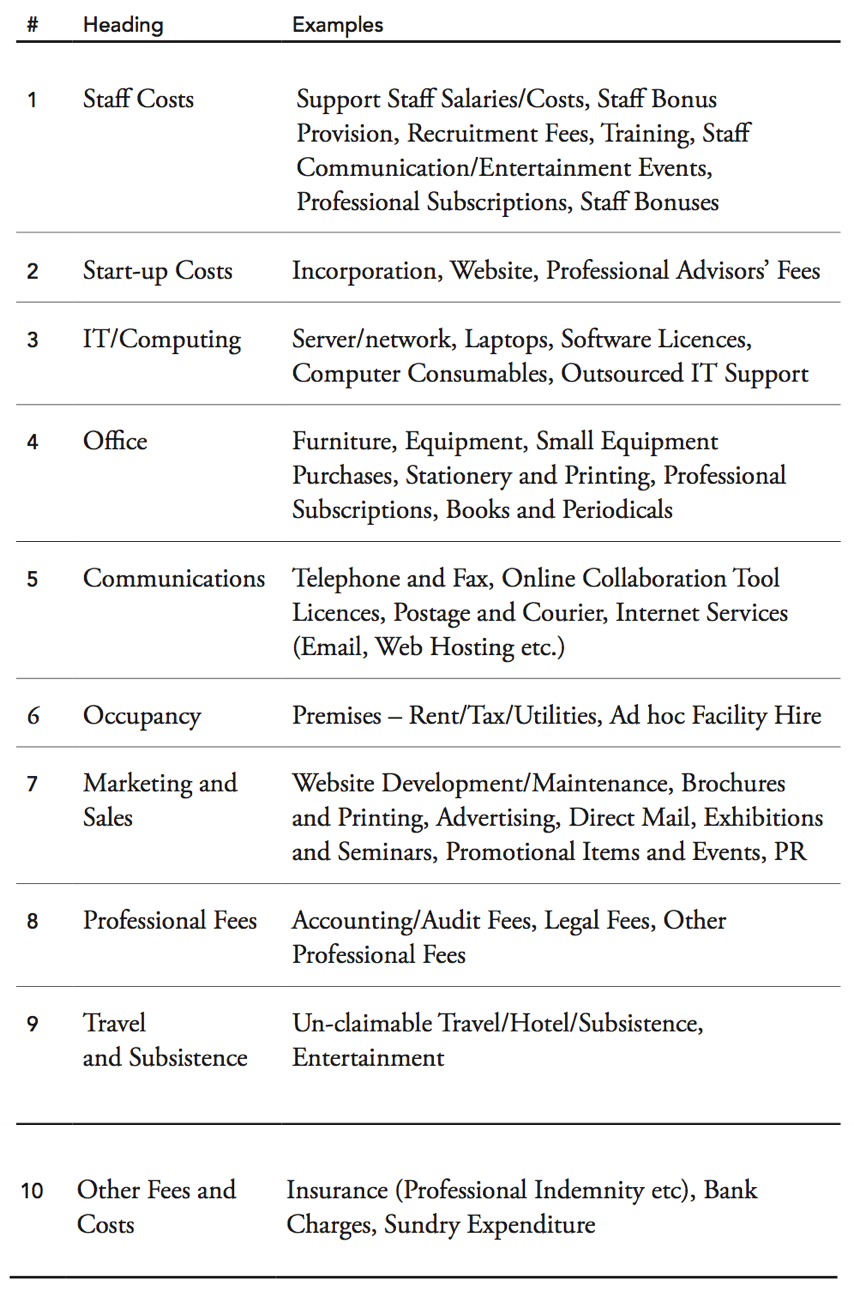
Table – Typical operating cost categories
Remember, there is always an element of ‘you don’t know what you don’t know’ in this kind of exercise so you are well advised to add a contingency row to this analysis (say, an additional 15% of overall operating cost).
Profit and Loss (P&L) Account This is where you bring together a critical business performance metric – as covered in previous blogs. That is, of course, your EBITDA (Earnings before Interest, Tax and Depreciation/Amortisation) as a function of subtracting your operating costs from your gross profit row (Sales minus ‘Cost of Sales’).
Following your EBITDA row, you deduct the costs of interest, corporation tax and any depreciation/amortisation charges (normally negligible in a professional service business) to ascertain how much net profit is actually available for potential disbursement to owners.
Balance Sheet
Whilst your profit and loss projection is a central component of your plan, it is only half of the story. An external valuator will also seek to know the state of your balance sheet which, at a snapshot in time, shows the company’s debt position, how solvent it is, how ‘liquid’ are the assets. Projecting your balance sheet, managing it towards a strong position and, generally, getting familiar with what it represents (if you are not a bean counter by nature) is important.
In simple terms, the balance sheet shows, at a moment, the matching balance between your ‘assets’ and your ‘liabilities plus owners’ equity’. Assets, and liabilities, are considered as either ‘current’ (relating to the current year) or ‘long- term’ (relating to payments/consumption that takes place beyond the end of the current year). Owners’ equity is made up of paid-in share capital and retained profits. In summary, therefore, a balance sheet can be represented schematically as follows:
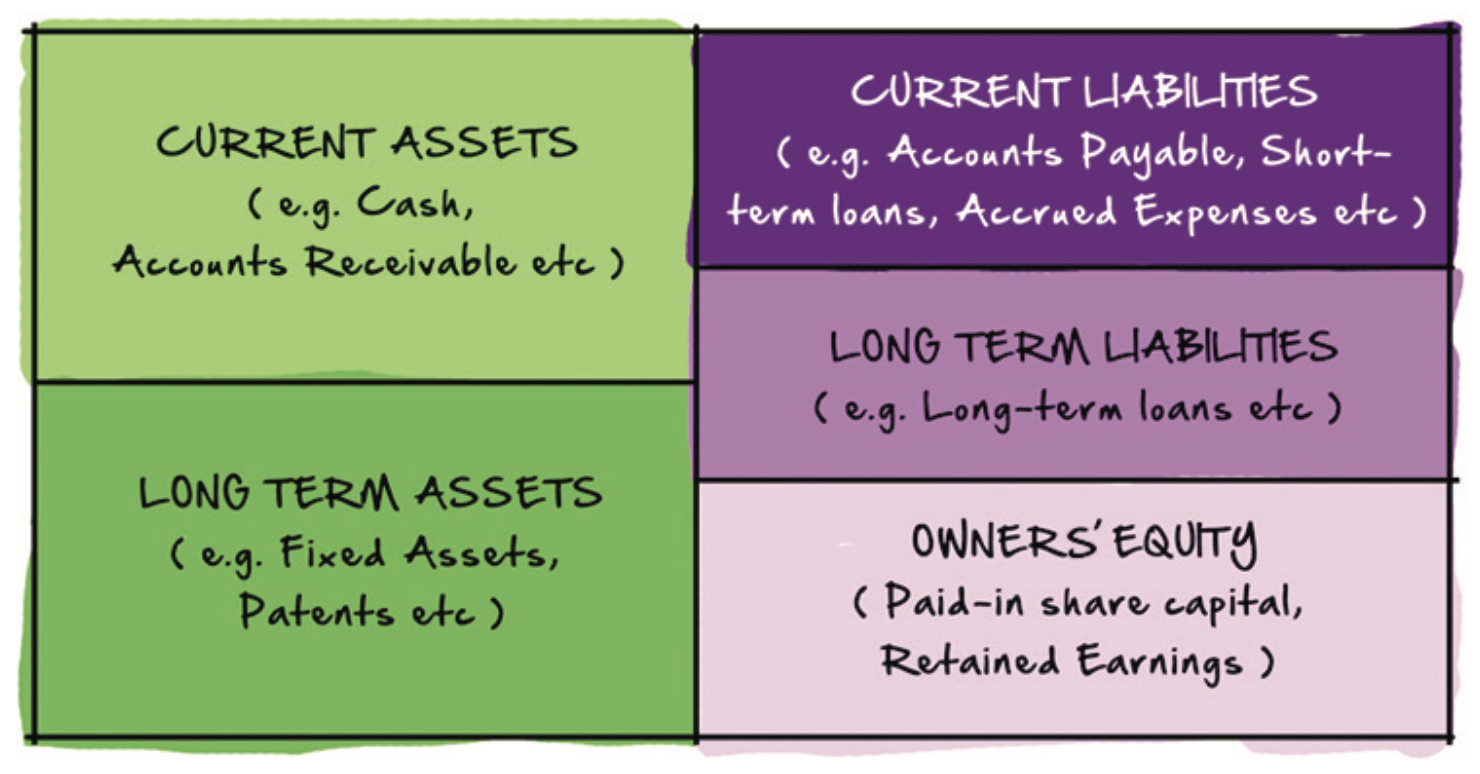
Figure – Balance sheet: left side = right side; assets = liabilities + owners’ equity
Projecting a balance sheet, and a cash flow, is actually reasonably simple once you work through the mechanics. Spending is always financed in one of three ways – either you pay cash on receipt of a good or service, you accrue an expenditure (i.e. pay for it later) or you prepay and expense it later. As such, you can allocate all the capital outlay and expenditure items from your P&L to your Balance Sheet dependent on which type of financing is involved. I do not wish to digress into the detail of this; rather you are best served reading a dedicated financial planning text at this point (such as the excellent The Definitive Business Plan previously referenced) if you need further guidance here.
Cash Flow and Funding Requirements
Your cash flow projection is where the ‘rubber really hits the road’. There are numerous cases of profitable businesses that go out of business because they run out of cash. So, you ignore this aspect at your peril; especially so when your primary creditors are going to be your own staff (whose salaries you must settle each month)!
Your cash flow projection shows your cash position at the end of every period and, therefore, your cumulative funding requirement or surplus. Developing this projection allows you to see the point where your cumulative cash flow reaches a trough and changes direction. This, in turn, points to your maximum funding requirement. It is such an axiomatic point, the next blog (Part 02) expands on this.
————
If you are interested in re-charging your business ambition/strategy/plans, Dom runs an annual (three-day) Five-Year Entrepreneur Retreat – see here for previous delegate testimonials and details on future presentations. If you would like to make a reservation (capped to 14 attendees per Retreat) please drop a line via the contact page.

DOWNLOAD GUIDE 03 (BUSINESS PLANNING) HERE >>>